The definition of air pollution indicators
Air quality index based on monitoring data will be on the same day in the air ozone(O3), suspended fine particles(PM2.5), suspended particles(PM10), carbon monoxide(CO), sulfur dioxide(SO2) and II Nitric oxide(NO2) such as the concentration of value, its impact on human health, were converted into different pollutants The vice-value targets, indicators, deputy to the day of the maximum value of the stations on the day of the air quality index (AQI).
IAQ (Indoor Air Quality)
People often spend more than eight hours a day in their homes; infants, kids and the infirm sometimes even spend the entire day inside their home. There is some evidence of asthma or asthma-like symptoms for children exposed to respirable suspended particulates or toxic gases in homes.
Where should I test?
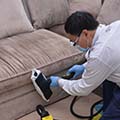
Samplings will be carried out in each room / indoor area at your home. Filtration efficacy of vacuum cleaners and air purifiers is also available upon request. Suggested testing locations include…
- Indoor air
- Vacuum cleaners
- Air-purifiers
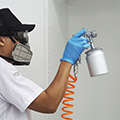
Testing device(s)
We adopt Kanomax™ Laser Particle Counter and to perform the test.
The concentration of pollutants and air quality index value deputy table
| Air Quality Index(AQI) | |||||||
|---|---|---|---|---|---|---|---|
| AQI | O3 (ppm) 8hr |
O3 (ppm) 1-hr(1) |
PM2.5 (μg/m3 ) 24-hr |
PM10 (μg/m3 ) 24-hr |
CO (ppm) 8-hr |
SO2 (ppb) 1-hr |
NO2 (ppb) 1-hr |
| Good 0~50 |
0.000 – 0.054 | – | 0.0 – 15.4 | 0 – 54 | 0 – 4.4 | 0 – 35 | 0 – 53 |
| Moderate 51~100 |
0.055 – 0.070 | – | 15.5 – 35.4 | 55 – 125 | 4.5 – 9.4 | 36 – 75 | 54 – 100 |
| Unhealthy for Sensitive Groups 101~150 |
0.071 – 0.085 | 0.125 – 0.164 | 35.5 – 54.4 | 126 – 254 | 9.5 – 12.4 | 76 – 185 | 101 – 360 |
| Unhealthy 151~200 |
0.086 – 0.105 | 0.165 – 0.204 | 54.5 – 150.4 | 255 – 354 | 12.5 – 15.4 | 186 – 304(3) | 361 – 649 |
| Very Unhealthy 201~300 |
0.106 – 0.200 | 0.205 – 0.404 | 150.5 – 250.4 | 355 – 424 | 15.5 – 30.4 | 305 – 604(3) | 650 – 1249 |
| Hazardous 301~400 |
(2) | 0.405 – 0.504 | 250.5 – 350.4 | 425 – 504 | 30.5 – 40.4 | 605 – 804(3) | 1250 – 1649 |
| Hazardous 401~500 |
(2) | 0.505 – 0.604 | 350.5 – 500.4 | 505 – 604 | 40.5 – 50.4 | 805 -1004(3) | 1650 – 2049 |
- Areas are generally required to report the AQI based on 8-hour ozone values. However, there are a small number of areas where an AQI based on 1-hour ozone values would be more precautionary. In these cases, in addition to calculating the 8-hour ozone index value, the 1-hour ozone value may be calculated, and the maximum of the two values reported.
- 8-hour O3 values do not define higher AQI values (≥ 301). AQI values of 301 or higher are calculated with 1-hour O3 concentrations.
- 1-hour SO2 values do not define higher AQI values (≥ 200). AQI values of 200 or greater are calculated with 24-hour SO2 concentrations.
AQI value and impact on health
| AQI | Air Quality Index (AQI) |
0~50 | 51~100 | 101~150 | 151~200 | 201~300 | 301~500 |
|---|---|---|---|---|---|---|---|
| Impact on Health |
Good | Moderate | Unhealthy for Sensitive Groups | Unhealthy | Very Unhealthy | Hazardous | |
| Status Color | |||||||
| Impact on Human Health | Air quality is considered satisfactory, and air pollution poses little or no risk. | Air quality is acceptable; however, for some pollutants there may be a moderate health concern for a very small number of people who are unusually sensitive to air pollution. | Members of sensitive groups may experience health effects. The general public is not likely to be affected. | Everyone may begin to experience health effects; members of sensitive groups may experience more serious health effects. | Health alert: everyone may experience more serious health effects. | Health warnings of emergency conditions. The entire population is more likely to be affected. |